RSM Evaluate
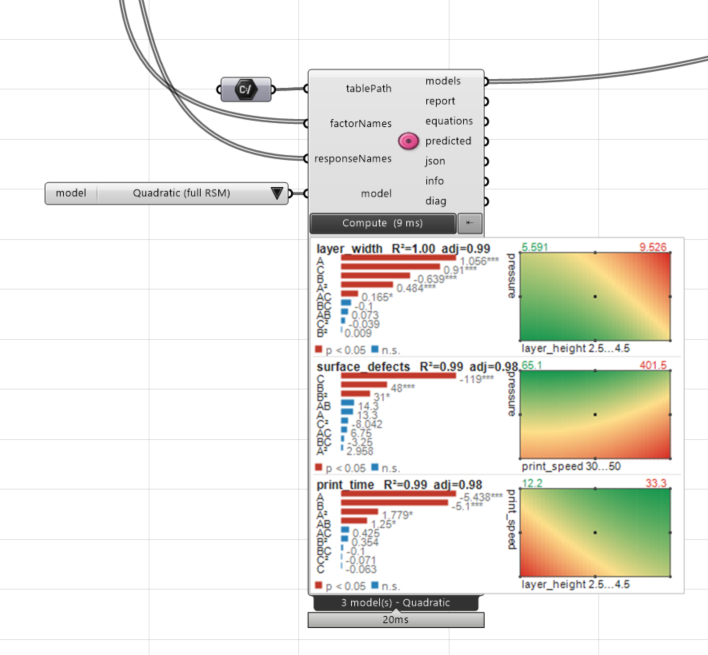
RSM Evaluate fits a formula to the measurements of a test series. For each measured result, the formula describes how the result depends on the settings. The component reports how strongly each setting matters, how well the formula fits the data, and diagnostics that show whether single runs or overlapping settings distort the fit. The fitted models are passed on to Desirability. The component has a compute button.
Panel: 6 Calibrate. Nickname: RSM. Compute button: yes (runs only when the button is clicked).
Inputs
| Name | Type | Default | Description |
|---|---|---|---|
tablePath |
Text | Measured .xlsx or .csv table path with named factor and response columns, used unless direct X data is supplied | |
factorNames |
Text (list) | layer_height; print_speed; pressure | Factor column names in model order, from DoE Design’s factorNames output |
responseNames |
Text (list) | Response column names to fit (empty = all other numeric columns) | |
model |
Text | Quadratic | Fit type: Linear, 2FI (with interactions) or Quadratic, dropping terms the data cannot distinguish |
transform |
Text (list) | none | Scale each response is fitted on. Use log1p or sqrt for counts, boxcox picks the exponent |
computed |
Text (list) | no | Use yes for a calculated response with no measurement error, otherwise no |
Optional group: Coding-range overrides (lows/highs/centres)
Right-click the component to switch this group on. The inputs appear only while the group is enabled.
| Name | Type | Description |
|---|---|---|
lows |
Number (list) | Factor low levels in actual units and factorNames order (unwired = data minima) |
highs |
Number (list) | Factor high levels in actual units and factorNames order (unwired = data maxima) |
centres |
Number (list) | Center per factor away from the midpoint (default: midpoint) |
Optional group: Direct data inputs (X/Y trees instead of a file)
Right-click the component to switch this group on. The inputs appear only while the group is enabled.
| Name | Type | Description |
|---|---|---|
X |
Number (tree) | Factor values in actual units, one branch per run in factorNames order, overriding tablePath |
Y |
Number (tree) | Measured responses in response units, one branch per run matching X and responseNames order |
Optional group: Excel report export input
Right-click the component to switch this group on. The inputs appear only while the group is enabled.
| Name | Type | Description |
|---|---|---|
xlsxReport |
Text | Local .xlsx file or folder to export on Compute with Export enabled, overwriting the target |
Outputs
| Name | Type | Description |
|---|---|---|
models |
Generic (list) | Fitted RSM models. Wire into the Desirability component |
report |
Text | Readable analysis report: coefficients, ANOVA and fit statistics. Connect a panel |
equations |
Text (list) | Model equations in coded and actual units, one per response |
predicted |
Number (tree) | Model predictions for the input runs, one branch per response |
json |
Text (list) | Model coefficients as JSON for archiving or external tools |
info |
Text | Diagnostics |
diag |
Text (list) | Regression diagnostics per response: leverage, studentized residuals, Cook’s distance and VIF. Connect a panel |
Back to Components.