DoE Design
DoE Design plans a series of test prints. You name the settings that should be tuned, give the lowest and highest value for each, and choose a plan type. The component produces a run table with one row per test print and one column per setting, plus empty columns for the measurements. The table can be exported to Excel or CSV and later read by RSM Evaluate.
Panel: 6 Calibrate. Nickname: DoE. Compute button: no (runs on every change).
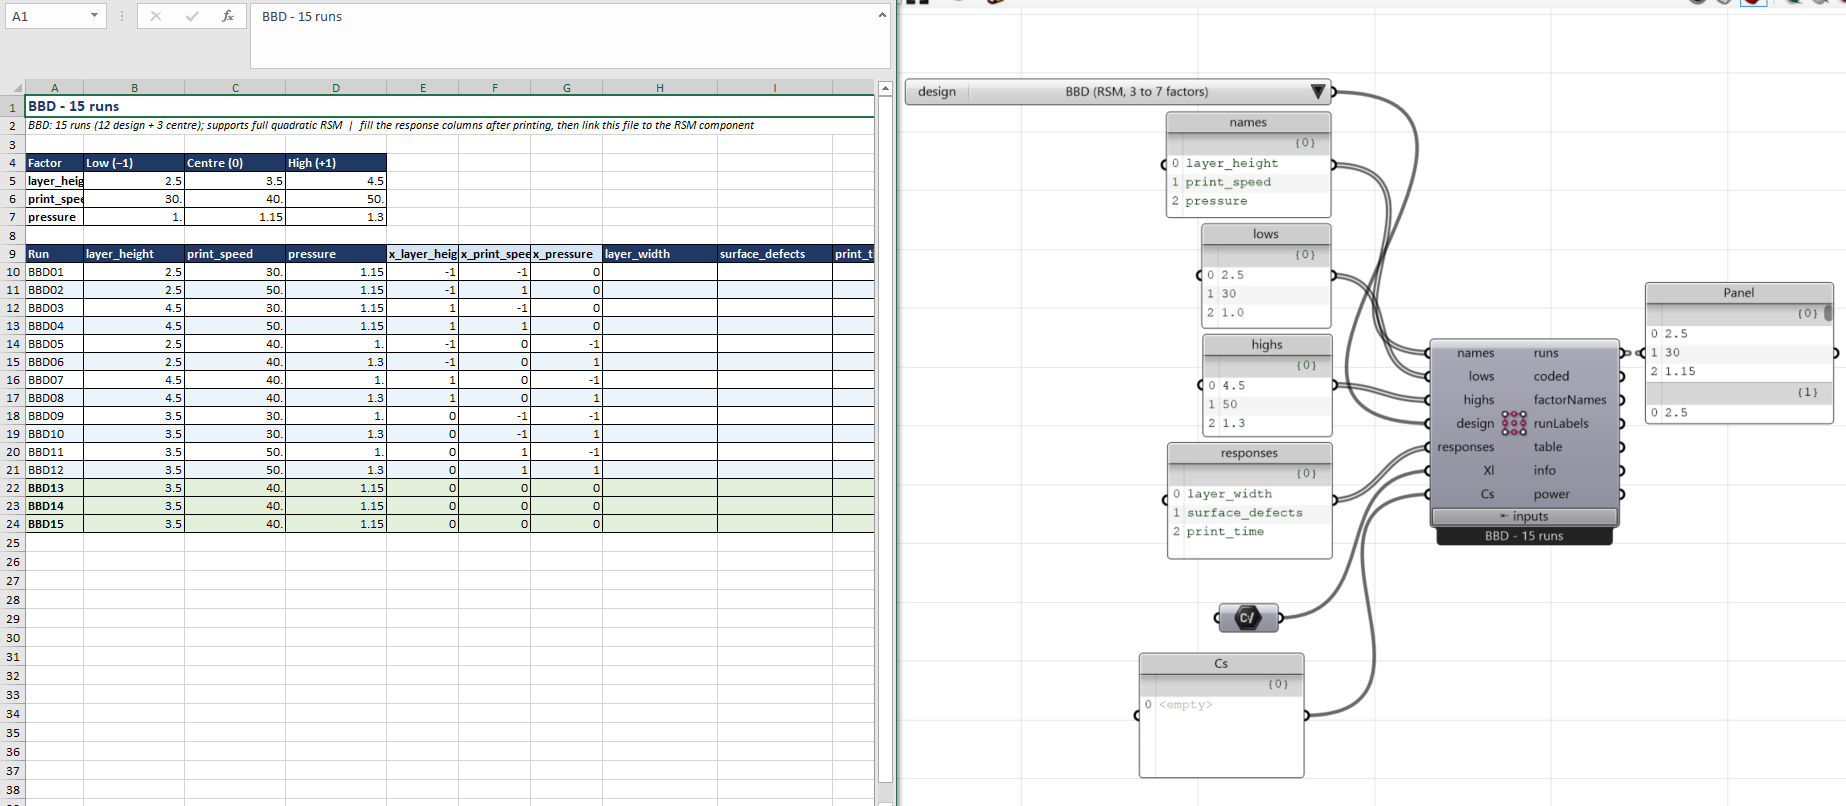
Inputs
| Name | Type | Default | Description |
|---|---|---|---|
names |
Text (list) | layer_height; print_speed; pressure | Factor names, one per item, for example layer_height, print_speed, pressure |
lows |
Number (list) | 2.5; 30; 1.0 | Factor low levels in actual units, in the same order and count as names |
highs |
Number (list) | 4.5; 50; 1.3 | Factor high levels in actual units, above lows and in the same order and count as names |
design |
Text | BBD | Design type: DSD (screening, 4 to 12 factors), BBD (RSM, 3 to 7), Taguchi (2 to 13), FullFact2 (1 to 10), FracFact2 (fractional two level, 4 to 9) |
responses |
Text (list) | layer_width; surface_defects; print_time | Response names. They become empty columns in the exported plan for lab measurements |
Optional group: Advanced options (centres, center points, levels, seed)
Right-click the component to switch this group on. The inputs appear only while the group is enabled.
| Name | Type | Default | Description |
|---|---|---|---|
centres |
Number (list) | Optional center level per factor away from the midpoint, for example pressure 1.15 in [1.0, 1.3] | |
centerPts |
Integer | -1 | Extra or total center points (-1 = design default, BBD 3 to 6, DSD 0) |
levels |
Integer | 3 | Taguchi factor levels, 2 or 3. DSD and BBD always use 3 |
seed |
Integer | 0 | Seed for the run order. 0 or higher randomizes with that seed, -1 keeps standard order |
fracRuns |
Integer | -1 | FracFact2: target runs 8 or 16 (-1 = auto: smallest with resolution ≥ IV) |
replicates |
Integer | 1 | Copies of every design row, including center points |
augment |
Text | none | none keeps the plan, ccd-face appends face centered star and center runs to a FullFact2 or FracFact2 plan |
Optional group: Power analysis (can this plan detect the effect?)
Right-click the component to switch this group on. The inputs appear only while the group is enabled.
| Name | Type | Default | Description |
|---|---|---|---|
powerSigma |
Number | 0 | Expected measurement scatter in response units, greater than 0 and required with powerEffect for the power estimate |
powerEffect |
Number (list) | Smallest response change to detect in response units, one value for all factors or one per factor | |
powerModel |
Text | Linear | Model that will be fitted to the data: Linear, 2FI or Quadratic. Power depends on its residual degrees of freedom |
powerSims |
Integer | 400 | Number of simulated experiments for the power estimate (more gives a steadier estimate) |
Optional group: Excel / CSV export inputs
Right-click the component to switch this group on. The inputs appear only while the group is enabled.
| Name | Type | Description |
|---|---|---|
xlsxPath |
Text | Local .xlsx file or folder to export on solve with Export enabled, overwriting the target |
csvPath |
Text | Local .csv file or folder to export on solve with Export enabled, overwriting the target |
Outputs
| Name | Type | Description |
|---|---|---|
runs |
Number (tree) | Run plan in actual units, one branch per run, factor values in input order |
coded |
Number (tree) | Run plan in coded units, -1 to +1 |
factorNames |
Text (list) | Factor names. Wire into the RSM component |
runLabels |
Text (list) | Run labels (BBD01, …) |
table |
Text | Readable run table. Connect a panel |
info |
Text | Design summary and warnings |
power |
Text | Monte Carlo power per factor at α = 0.05. Enable the power group and connect a panel |
Back to Components.